Critical Path Analysis
June 27, 2022
visio critical path analysis, ms visio, work diagram Leave a comment
Work Breakdown Structure
June 17, 2022
visio ms visio tutorial, wbs in visio, work breakdown structure Leave a comment
Shape Data and Data Graphics
May 24, 2022
visio data graphics, ms visio tutorial, shaes data, visio Leave a comment
Organisational Charts
April 25, 2022
visio ms visio, org charts, Organisational charts Leave a comment
Connecting Shapes in Microsoft Visio
March 28, 2022
visio ms visio, ms visio connecting shapes, shapes connections Leave a comment

BASIC DIAGRAMS
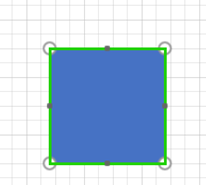
The following example shows some of the basic drawing principles. To add shapes simply drag them on to the drawing canvas.
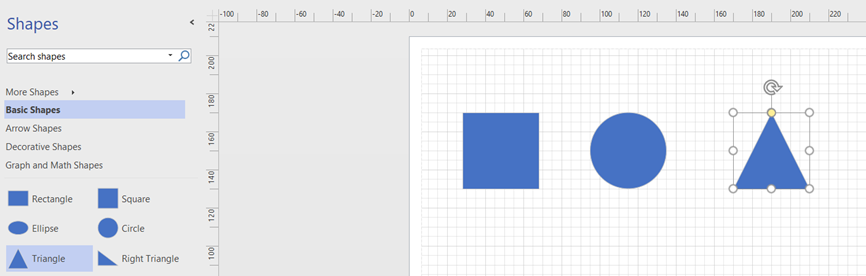
Several shapes are positioned onto the drawing canvas.
When you drop the shape on the grid it will snap to the nearest grid line.
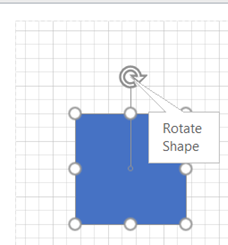
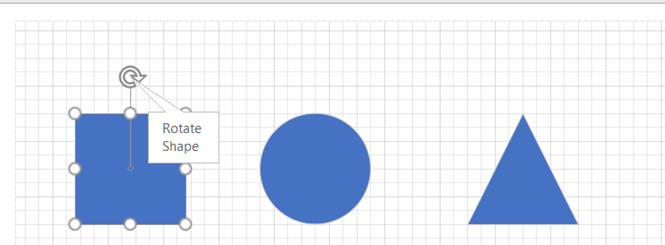
The white circles facilitate size changes; the small circle at the top of each shape provides rotation options.
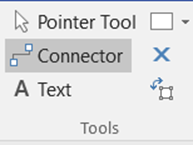
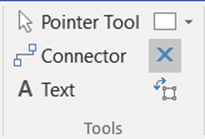
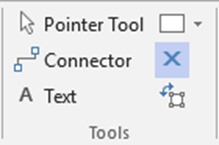
When the connector tool is activated shapes display connection points when the mouse hovers over the shape.
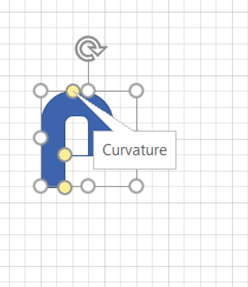
Some of the shapes will have yellow circles (Control handles) these have distinctive features for each shape. If you hold your mouse over the shape, you will see a text box description as shown below.
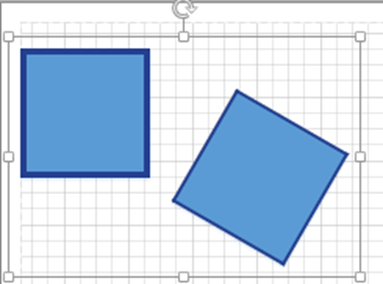
If you want to move several shapes in one go, you can use your shift key to select each shape or drag over them with your mouse and then move them as a group.
There are two types of shapes, one-dimensional and two-dimensional as shown below.
CONNECTING SHAPES
In Microsoft Visio, drawings such as flowcharts, block diagrams and organisational charts are all connected drawings.
There are three main types of connector in Visio, Inward, Outward and Inward/Outward.
Inward connectors:
Most shapes have inward connection points, which means that you can glue connectors or other shapes with Outward connectors to them. (Black Squares)
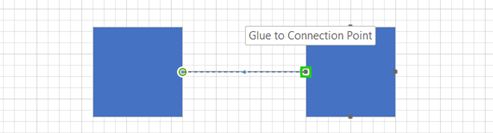
Outward Connectors:
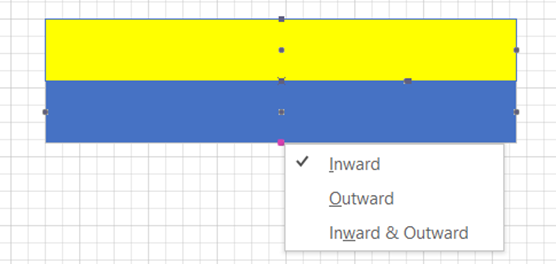
A 2-D shape with an Outward connection point can be glued to another 2-D shape with an Inward connection point. Right click on the connection point to change the type. Firstly, activate the Connection Tool.
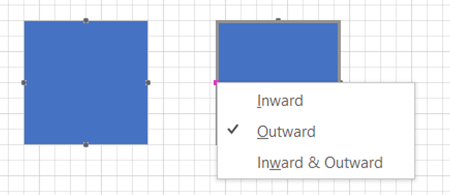
Once the connector is changed it will glue to the Inward connector on the other shape and move as one.
Inward/Outward Connector
Use inward/outward connection points to allow shapes to be glued together in any order. An inward/outward connection point behaves like an inward connection point when you glue a 1-D connector or the outward connection point of a 2-D shape to it. It behaves like an outward connection point when you glue it to another 2-D shape. For example, in the Office Layout template, the work surface shapes have inward/outward connection points at each end so that work-surface components can be glued together in any order.
When you create your own shapes, you can set their connection point type.
Use inward connection points in drawings that use connectors (connector: Any one-dimensional (1-D) shape that can be glued between two shapes in a drawing to connect the shapes.) to connect shapes, such as flowchart diagrams.
Use inward or outward connection points when you want to glue 2-D shapes together in a particular direction or order. For example, in an office layout diagram, if you want outlet shapes to be attracted to walls:
Set the outlet shape to have an outward connection point.
Add inward connection points to the Wall shape (perhaps spaced according to electrical wiring code).
Use inward/outward connection points to allow shapes to be glued together in any order. For example, if you have a wall shape with inward/outward connection points, it won’t matter which wall segment you drag first; it will always glue to another shape. However, if you have an outward connection point on one end of the wall and an inward connection point on the other end, you will need to drag the outward end to an inward end to glue the walls together.
There are two types of glue in Visio
Shape to Shape and Point to Point
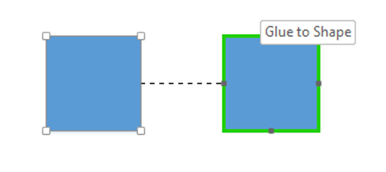
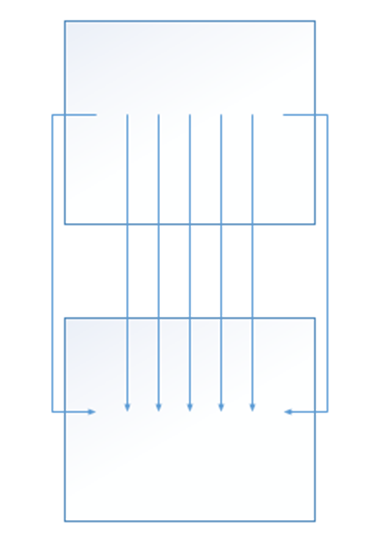
Shape to Shape
With shape-to-shape glue (also known as dynamic or “walking” glue), a connector stays glued to shapes by moving to the closest available connection points as the shape is repositioned.
Point to Point
With point-to-point glue (also known as static glue), a connector stays glued to its specific connection point on each shape when you reposition the shapes.
A shape’s connection point turns red when you glue a connector to a specific point on a shape.
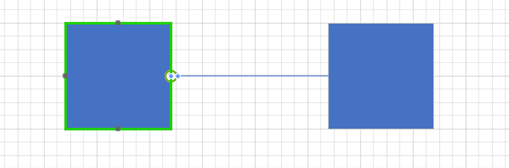
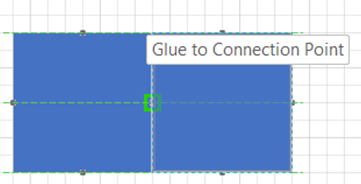
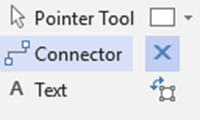
To create a shape-to-shape connector, click the connector tool on the toolbar.
Drag the first shape into position and leave it selected then drag the second shape into position. The connector will snap into place.
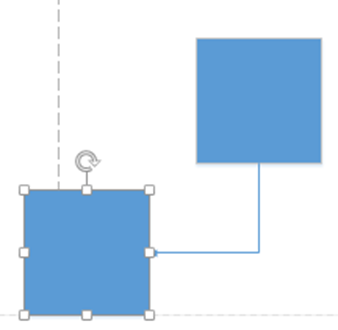
Shape – To – Shape the outline on the boxes turn green as you float over them (not over a connection point).
When the shape is moved the connector moves to the nearest point.
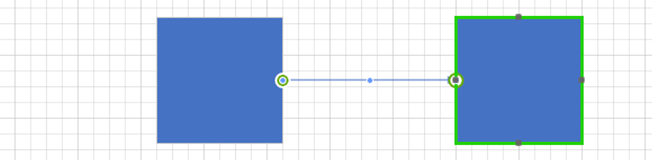
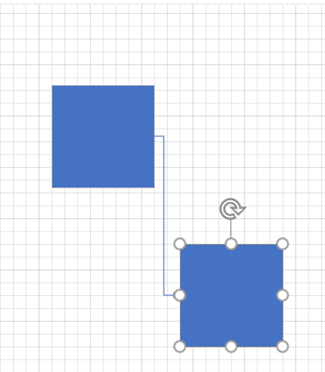
Point-to-Point connections
Use the pointer tool to drag two shapes on to the grid.
Click the connector tool and hover over the first shape until the connection point is highlighted, then drag to the other shapes connector point.
If you move either of the shapes, the connection will be glued to the original position.
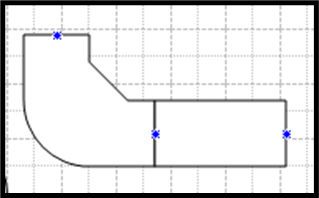
Although shapes have pre-set connection points, you can add additional connection points by selecting the connection tool.
Hold the Control Key down and click on the shape to apply the new connection point or points.
You can use the connector tool to join the new connection points as shown above.
Remember connection point properties are changed by right clicking the point.
Courses
Check out courses at Training courses
Shapes
Connections
Connection points
Scheduling in Visio
March 17, 2022
visio gantt charts, scheduling, timelines Leave a comment
Timeline
One of the scheduling tools in Microsoft Visio is the timeline tool. The timeline has block intervals, today marker, elapsed time indicator and much more. Timelines have an expand feature which focuses in on a date range. The Shape data window displays % complete and other related data.
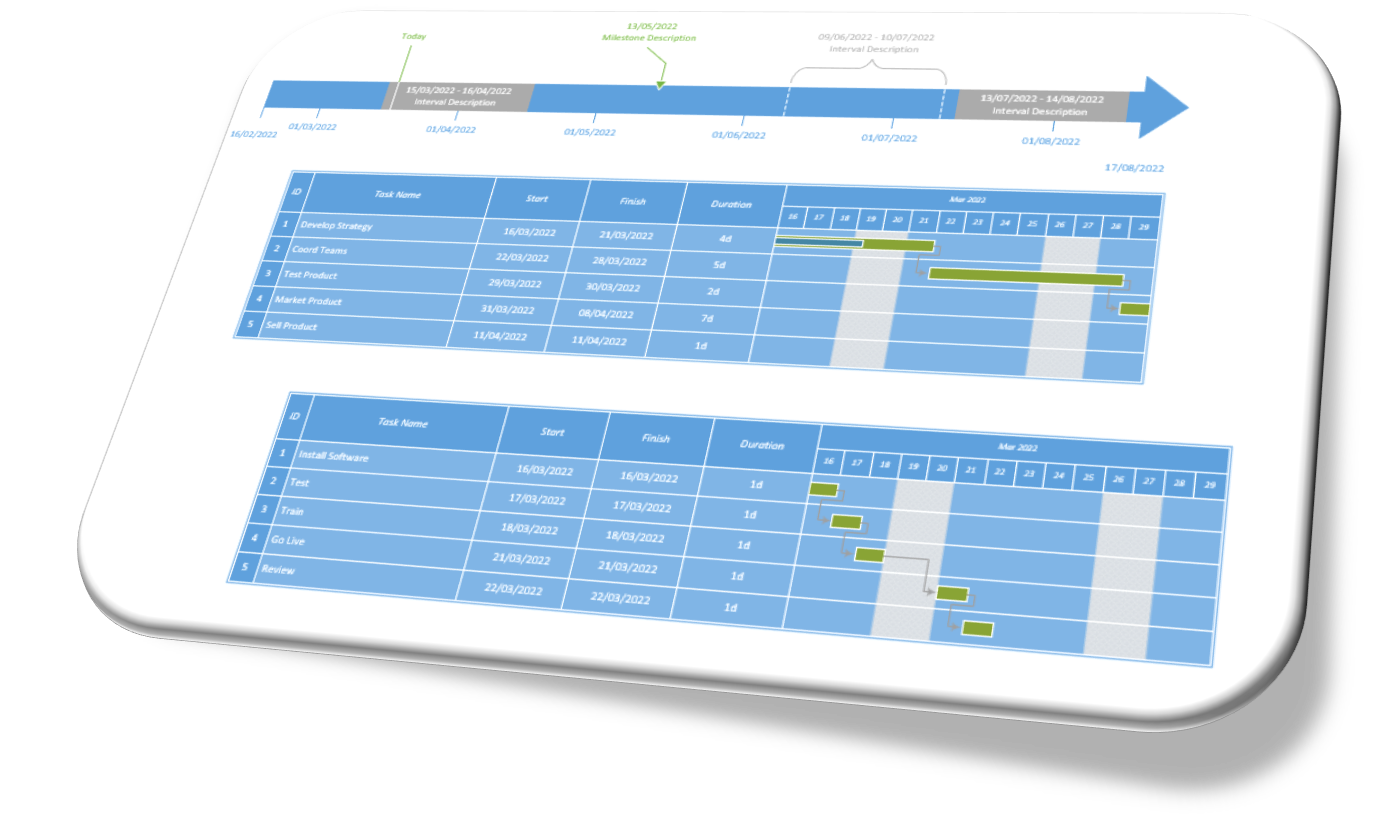
Gantt Chart
The Gantt chart template in Microsoft Visio provides a great scheduling tool. Each Gantt chart block has detailed information displayed through the shape data window. The Gantt charts have links, lead and lag also % complete options. Extra columns of data is display either by clicking the right mouse and insert column or by dragging the column shape onto the Gantt chart.
Other Scheduling in Visio
There are two other tools available under schedule. A calendar template and a Pert diagram template. With these extra two diagram templates there are four tools altogether, providing a good baseline for project management.
Courses
Search for courses here
Search for online courses here
Courses are delivered in three formats. The first format is, one to one, this is a tailored session covering topics selected by the student. Classroom based, this is a structured session following the course outlines. Online, this course follows the format of either of the other two.
Link Excel to Visio
March 14, 2022
Excel, Excel Training, visio link excel to a flowchart, link excel to visio Leave a comment
Link and Excel spreadsheet to a Visio Flowchart
The first step to linking Excel data to a Visio flowchart is to create a blank flowchart. On the Ribbon, select the Data tab and Quick Import from Excel. A wizard starts and once the correct file is selected, the data links appear along with the data graphics options.
Linked Shapes
To use the linked data in Microsoft Visio, select the shape type required from the stencil but do not drag it onto the diagram. Drag the linked icon from Shapes data onto the screen. This action places the selected shape on the screen with associated data graphics attached.
Data Graphics
The associated data graphics appear on the right side of the shapes. Data graphics are changed through the advanced data graphic option. New graphics are added here if required or old ones are edited here. Process names for example, sometime appear in the centre of the shape. Labels are also removed from this option.

Updating
If the source Excel data changes, the Microsoft Visio flowchart is refreshed from the data tab.
Courses
Search here for courses
Search here for online courses.
Buy training sessions online, classroom based or via Microsoft Teams. All courses come complete with training manuals and examples.
Gantt Chart in Visio
March 10, 2022
visio gantt chart, ms visio Leave a comment
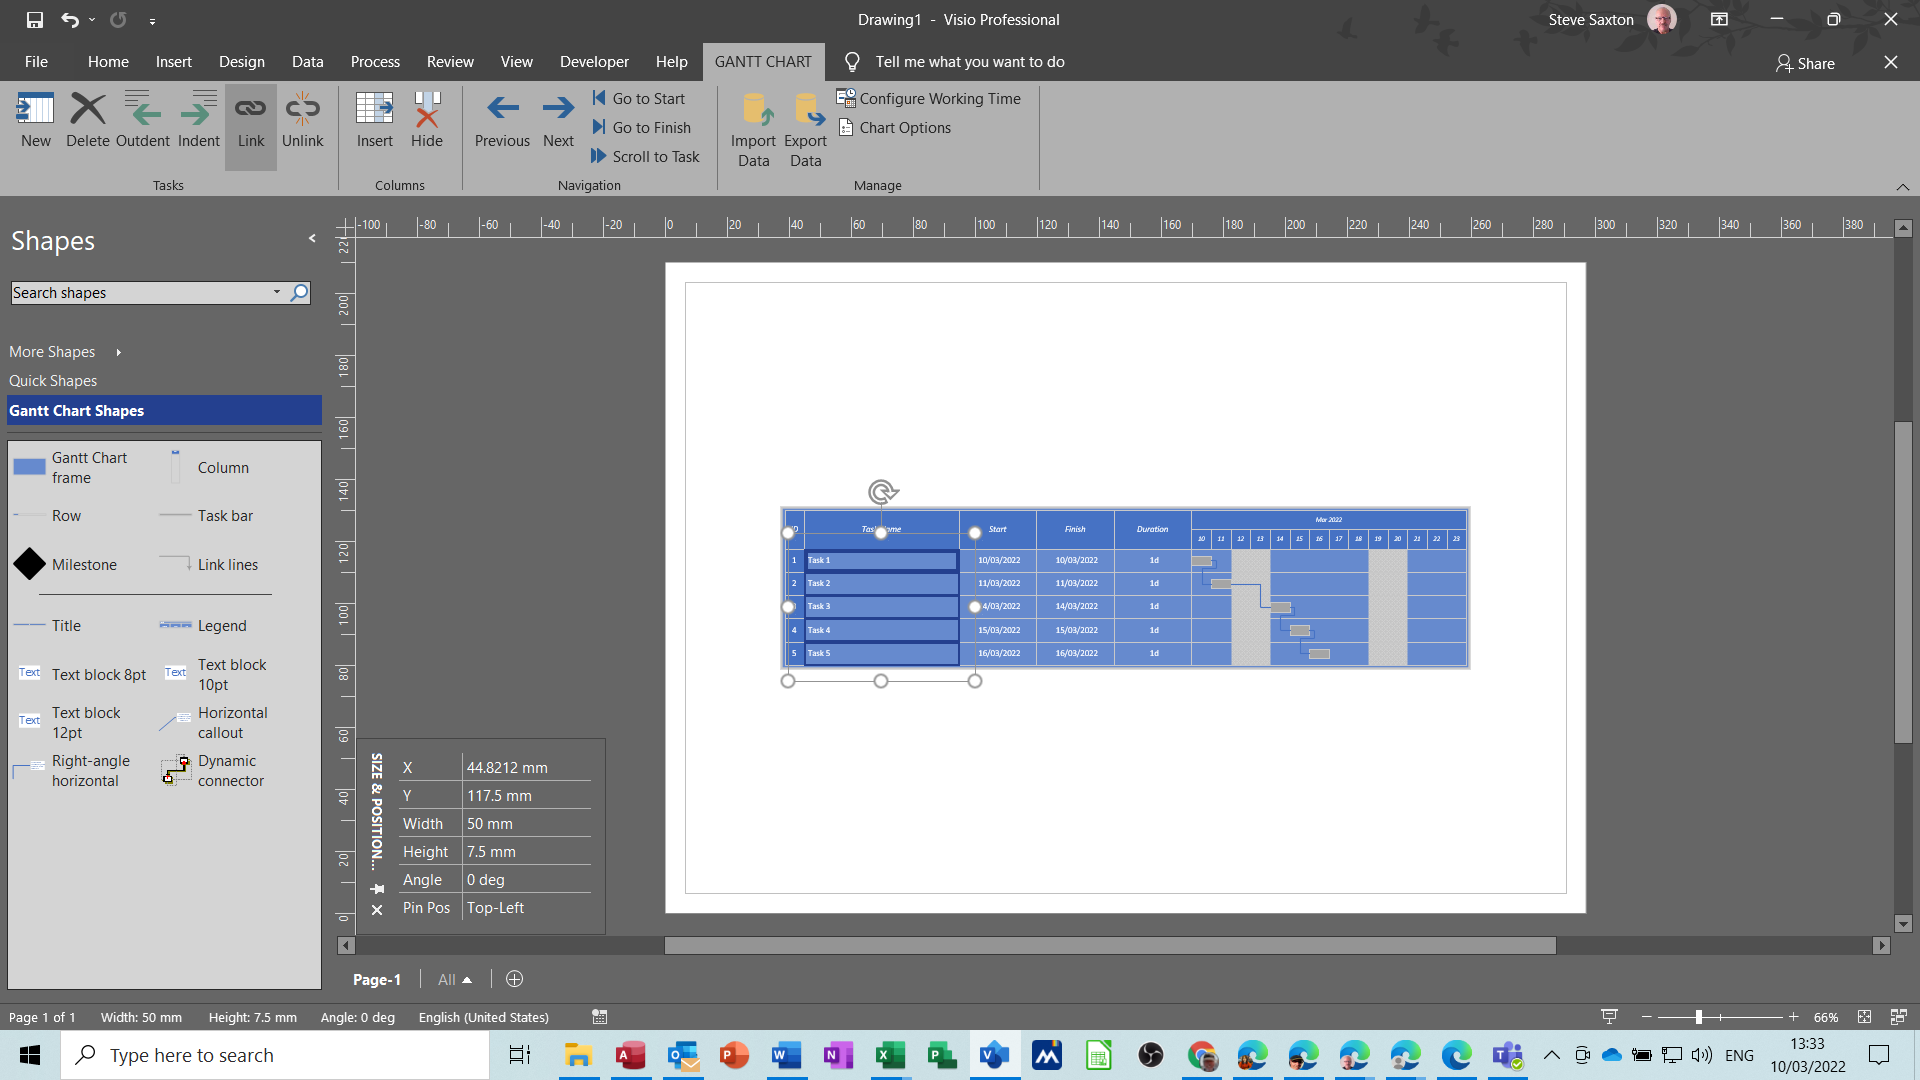
How to create a Gantt Chart in Microsoft Visio
The Gantt Chart feature is under the Scheduling category in Microsoft Visio. There are three options: A Calendar, a Timeline and a Gantt Chart. Select the option required..
Timescale
The timescale and date formats are set on the first screen in Gantt Chart options.
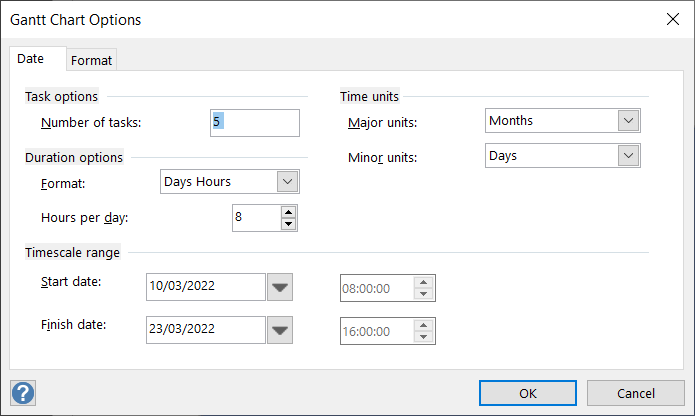
The number of tasks are set in the option box. Keep task numbers to a minimum as Microsoft Visio has limited Project Management tools available.
Linking Tasks
To link tasks, select all the tasks and then on the Ribbon select Link.
Outline Level
To use the top task as a summary task, an outline level is required. To set the outline level use the shape data area for the task or insert the outline level column and type the level in the column.
Update tasks
Use Shape data to update tasks and add any other information as required. Resource names and Outline levels are set in Shape data.

Lead and Lag Time
To set Lead time, select the link line. In the shape data window type a positive number for lag time and a negative number for lead time.
Export a Visio Gantt to Excel or Project
On the Gantt Chart tab of the Ribbon select either option, export to Excel or Project. The file selected contains the Gantt chart data.
Courses
Search for courses here
Search for online courses here.
Buy training sessions online, classroom based or via Microsoft Teams. All courses come complete with training manuals and examples.
Design a Room
February 8, 2022
visio design a room, ms visio, plan a room Leave a comment
How to design a room in Microsoft Visio
Using Microsoft Visio makes designing a room easy and simple. The first step is to create the room shape. Once the outside dimensions are added, add doors and windows. Electrical sockets and furniture are added next. Make sure the furniture measurements are correct, this can be done using the shape size and position window.
Layers
Once the room design is complete, or most of the basic elements are in place, it makes good sense to create a layer and lock that layer. Once a layer is locked, no shape can be moved. Additional shapes can still be added, and additional layers created. Layers do really help when designing a room.
Measurements
All the dimensions for walls, doors and windows only display if they are selected. To display measurements that will print off, you need to add measurement tools to the shapes. These are available in the stencil.
Training
Microsoft Visio courses are available here
Online courses are available here
Plan a room in Visio
If you plan a room for use by a builder, make sure you tell them that your diagram is a rough outline and not a perfect plan. Otherwise, they may use your design and measurements, which may not be accurate. A Visio design created by a novice is a useful starting point for a designer or builder but should only be a guide.

