Home

Multiple Scenarios

Leave a comment

Create Multiple Scenarios in Microsoft Excel

The Scenario Manager in Microsoft Excel is part of the What IF Analysis tools feature found on the Data tab of the Ribbon. Users can add different scenarios all with different data sets, and then see the impact through the Scenario Manager.

Actual

It is recommended to create an actual scenario so that the intitial data set can be retrieved if required. Multiple scenarios can be added into the scenario manager and the results shown or displayed. However, there is a limit to the number of changing cells that can be used.

Summary

Use the scenario summary feature to compare results side by side. The current figures column is a duplicate of the last screen viewed; it can be deleted. Each summary sheet is a dead copy and not linked to the source data in anyway once displayed. Old summary sheets should be deleted to avoid confusion. It is advisable to create everything before any meeting takes place as it is a lot more difficult to produce the correct results on the fly.

Formulae in Scenarios

To create a formula, type the equals symbol first and then the formula. As soon as you click OK the formula is converted to a number and cannot be seen anymore. Before you start the process select the Actual option, otherwise the result may be incorrect.

Select courses here.

Select online courses here.

Training courses take three formats, one to one, classroom based or online sessions through Microsoft Teams. All courses have after course support available and training manuals and examples used are available on request.

Custom Filters

Leave a comment

Custom Filters in Microsoft Project

To create your own custom filters, select the View tab of the Ribbon and then filters. In the filters area, select New filter, and in the presenting dialogue box, type your criteria. In the video, the tutor demonstrates how to create two custom filters. The first filter searches for tasks that are over 75% complete, the second filter compares the Actual Cost field against the baseline cost field.

Display in Menu

When a new filter is added to the filter list, there is an option to have it displayed in the menu. When this option is selected it appears at the top of the filter list, above built-in filters.

Delete a Custom filter

There are no options to delete a customisation from the filter list. To delete a custom filter that is no longer required. Select the More Views or More Tables option on the View tab of the Ribbon. Once selected, select the Organizer option. In the organizer, select the Filter tab. The filter tab displays two screens, the right side is the current document, the left the Global documents. Delete from both areas if required.

For training courses, search here.

For online courses search here.

Multiple Presentations

Leave a comment

Combine Presentations

To add multiple presentations to one file, select Custom Shows from the Slide Show part of the ribbon. The custom show feature enables users to select a random number of slides to create a specific show. Each show runs independently of the main presentation and does not include all the slides. 

Once a custom show is ready, the best use is to create a hyperlink to it from either a photo or a text box. When the presentation is in full screen mode, clicking the hyperlink will run the custom show only. It is important that the custom show returns to the starting slide when set up. Creating several custom shows within one file achieves great flexibility in PowerPoint. For example, if you have a sales team each with their own presentation, using custom shows and hyperlinks brings everything into one place.

Sections

Using the sections feature in Microsoft PowerPoint gives great flexibility to any presentation. Each section created is independent of the other sections and formatting one section does not affect another. Sections can be moved around as a group, making presentation management easier.

Course details search here.

Online courses search here.

Courses

Courses are available online, classroom based or via Microsoft Teams. Online courses are video based and included all the training material, exercises and examples.

Drop down lists in Microsoft Acess

Leave a comment

Lookups in Microsoft Access

There are several places to create a drop down list in Microsoft Access. The lookup lists are very useful in avoiding typos and stopping disallowed entries being added to a database.

Combo Box Lookup

The Combo box drop down list is one of two display options available within lookup properties. The other option is a list box. The main difference between the two is how the data are displayed in forms or reports.

Looking up a table or query

Select the type of box you require, there are three options from the Row source area. The first option is a Table or query. The table/query option is used when there is an existing table or query holding the list. There is an option to create a new query on this line if required.

Value List option

The second option from the Row source line is a value list. A value list is used when you don’t have a table and want to type a short list. Each element in the list is separated by a semi colon.

Field List option

The final option is a field list. This option uses the fields from a second table as the lookup options. Items are added when new fields are added to the lookup table.

Limit to List

The limit to list option is used to restrict data entries that should not be in the list. For example a list of products. Only the products that are in the list can be used, not additional products.

Form Lookup

It is better to create the lookups at table level but they can be added to a form. There is a third option on a form which enables users to search for records.

Check out courses here.

Online course can be found here.

Remove Columns

Leave a comment

How to remove columns in Microsoft Word

To add or remove columns in Word the first stop is the Layout tab on the Ribbon. The Columns feature displays several options.

Column options

Once you select the number of columns required they are displayed on the ruler.

rurler with columns

To move between columns you will have to insert a Column break. Column breaks can also be found on the Layout tab of the Ribbon.

column breaks

Once the column break is in place you can move from one column to another and back again.

two columns

Section Break

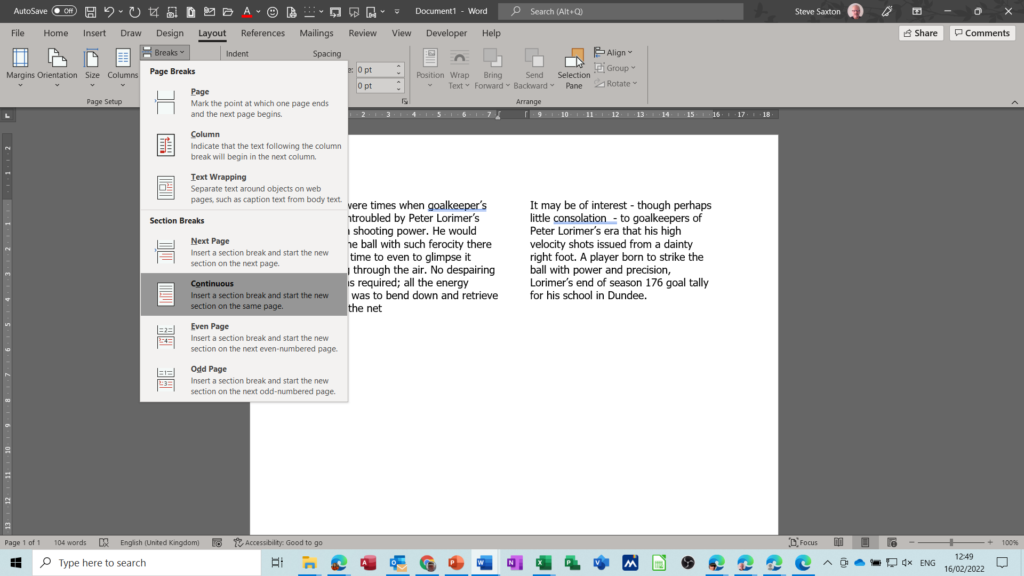
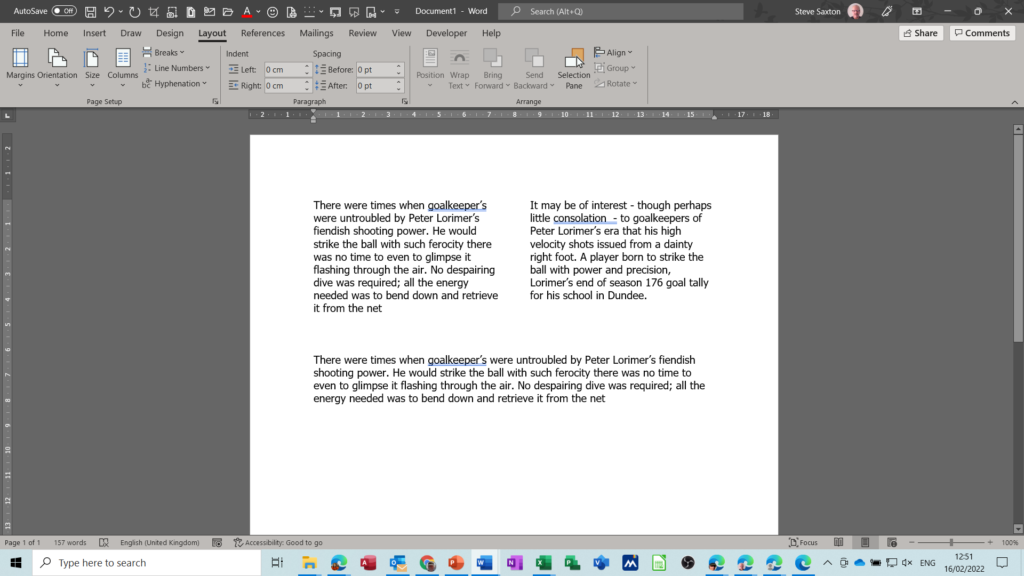
To remove columns, you will need to add a section break continuous and then reset the columns to one. This method will put the page back to its default of one column.

section break
one column default

Draft/Outline View

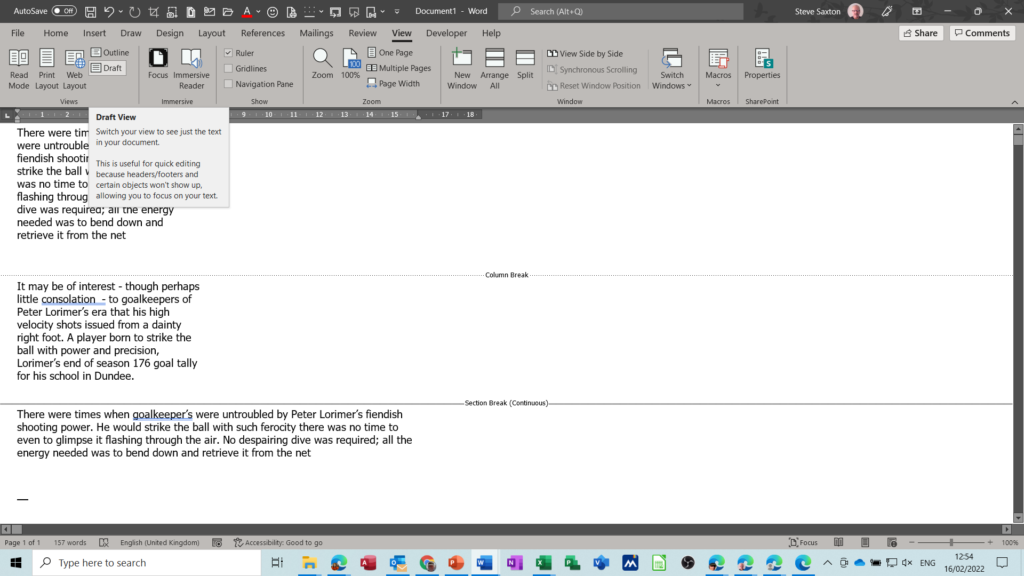
To see any section or column breaks and even hard page breaks, you have to select the View tab on the Ribbon and either Outline or Draft view. In these views you can remove the section or column breaks if required. Check the impact of the removal before saving the document. Section breaks for example are used to change orientation of a page within a document. Deleting a break may mess up the layout altogether.

draft mode

Check out courses here

Online courses are here

Bradford factor

Leave a comment

The Bradford factor is a tool used by HR to track, monitor and review absenteeism. The tool was developed in Bradford university and is used widespread in business.

Bradford Formula

The Bradford factor is quite a simplistic tool. Each sick day is recorded, and each separate sick occurrence is also recorded. Once all the data are gathered the formula is applied. The calculation used is as follows: sick days multiplied by sick occurrences, multiplied by sick occurrences. For example, is someone has three separate days off sick, the formula would be = 3*3*3 =27. However, if the person has three consecutive days of sick, the formula would be =3*1*1=3.

Bradford Factor review scores

As guide the following scores are used to trigger reviews: Score of 45, Concern, 100, Disciplinary and 900 Dismissal. These scores are just a guide, each company can set their own scores.

Trainig courses can be found here.

Online courses can be found here.

HR Tracking

The Bradford factor is a great HR tool to help track trends and keep on top of slacking staff. It is not a tool to be used as a stick to keep staff inline.

Bradford factor example

HR Tracker

Leave a comment

The HR Tracker can be used to track sickness, absent staff, holidays, and lateness. Basically, whatever you want to track you can use conditional formatting in Microsoft Excel to help analyse it.

Conditional Formatting

Each word or letter can be formatted to display a colour in Excel. In this case, blue = sickness, red = lateness, black = absent and mustard for holidays. The black colour will require the font to be white otherwise the letter will not be seen.

Countif Function

The Countif function is a great function to count the occurrence of a text string within a range. In this example the Countif function counts the number of each letter type.

Summarise

The whole point of HR tracing is to track and summarise data trends and act upon the results. Each month of HR data is tracked and added up. The Sum function is used to add all three-monthly totals.

Charting Data

The charts in the HR tracker represent three months of sickness, holidays, absence and lateness. Each person has their own HR chart which is colour coded to match the conditional formatting in the HR calendar.

Excel courses can be found here

Online courses can be found here

The example shown only shows data for two people and for only three months. If your organisation is much larger, a sheet per person may be required. Alternatively, a database model, such as Microsoft Access might be better. For small companies, Excel should be fine. The Bradford factor is mentioned in the video. This is a tool to capture people that tend to go off on the sick, as and when, they want. The Bradford factor multiplies sick episode by sick episode by the total days sick. A sick episode is one day of sickness, three continuous days off sick, would still be one episode.

Email merge directly from Microsoft Outlook

Leave a comment

Email merge

Email merge is part of the mail merge feature that comes with Microsoft Word and other word processing packages. Mail merge is often started from Word, where the first step is to connect the email message or document to a data source. However, mail merge can be started from the data source directly. A data source is a list of addresses and emails which are used as part of the merge process.

Outlook merge

To use the email merge feature in Outlook, the first step is to select the Contacts list that has the data source. If you do not want all the records in a data source to be used, select only those required by using the control key to select non-adjacent records. From the ribbon activate the Mail merge wizard. The wizard displays several options, which can be deselected or changed. Once all the steps are complete close the wizard. Microsoft Word should now open, and the Outlook data are attached. Simply add any merge fields then complete the email merge.

Final Check

It is always a good idea to add your own email to the contacts list so that you can see the result. Some users will have emails set to text only, others to HTML. The final check is to see how the email displays. For example, does the email look the same when received, as it did in its original format.

Check out courses here

Check out online courses here

Link Cells together

Leave a comment

Join cells together in Libreoffice Calc

There are two main ways to link cells together in Calc, using the Concatenate function or using the & symbol. Both methods will pull data from separate cells and join them together. If you require spaces between the cell information, add open quotes and then a space, followed by close quotes.

The & Symbol to join cells

To use the & symbol, start your formula in the same way as always, with the equals sign, then select your first cell. After the first cell type the & symbol and the open quotes to create a space then close quotes. This space will appear between the data in linked cells. Now type another & symbol and click on the second cell. If you have more cells to join repeat the process, then finally click the tick.

To use the concatenation function to link cells, select the function wizard. Once the wizard opens, type concatenate to find the correct function. When the function wizard displays the boxes to select cells, start the process by selecting your first cell. In the second box displayed, add the open and closed quotes. (This gives you the space). Next select the second cell and so on. Once all the cells and spaces are created click OK.

Text to Columns

If you have data in one single cell that should appear in multiple cells, you can use the Text to Column feature. The text to columns feature is on the Data Tab of the Ribbon. Once activated the wizard steps through the process. How your data are displayed, will depend on which options to select. When you have finished, click OK and the cells will spill over into the cells as selected.

Check out courses here

Online training courses here

Check out other video on my YouTube channel here

Design a Room

Leave a comment

How to design a room in Microsoft Visio

Using Microsoft Visio makes designing a room easy and simple. The first step is to create the room shape. Once the outside dimensions are added, add doors and windows. Electrical sockets and furniture are added next. Make sure the furniture measurements are correct, this can be done using the shape size and position window.

Layers

Once the room design is complete, or most of the basic elements are in place, it makes good sense to create a layer and lock that layer. Once a layer is locked, no shape can be moved. Additional shapes can still be added, and additional layers created. Layers do really help when designing a room.

Measurements

All the dimensions for walls, doors and windows only display if they are selected. To display measurements that will print off, you need to add measurement tools to the shapes. These are available in the stencil.

Training

Microsoft Visio courses are available here

Online courses are available here

Plan a room in Visio

If you plan a room for use by a builder, make sure you tell them that your diagram is a rough outline and not a perfect plan. Otherwise, they may use your design and measurements, which may not be accurate. A Visio design created by a novice is a useful starting point for a designer or builder but should only be a guide.

Older Entries